This topic applies to Fortran
applications for Windows* only.
The remote debugging scenario described here includes the cross-platform and cross-compilation remote debugging features. The following parameters apply:
Host platform: |
IA-32 |
Remote platform: |
Intel® 64 |
Name of host machine: |
HOST_MACHINE (domain name of host machine) |
Name of remote machine: |
REMOTE_SERVER (domain name of remote machine) |
Host OS: |
Windows* 7 |
Remote OS: |
Windows* Server 2008* Enterprise x64 Edition |
Executable for debugging: |
Win64 (x64) |
Type of executable: |
Console application |
Visual Studio*: |
Microsoft Visual Studio* 2012 |
Connection types: |
Remote with/without Windows authentication |
Sessions: |
Remote debugging, remote execution, attach to process on a remote machine |
- HOST_MACHINE
Start Visual Studio* 2012 on the host machine (HOST_MACHINE).
Create a new console application; for this example, use remote_2012.
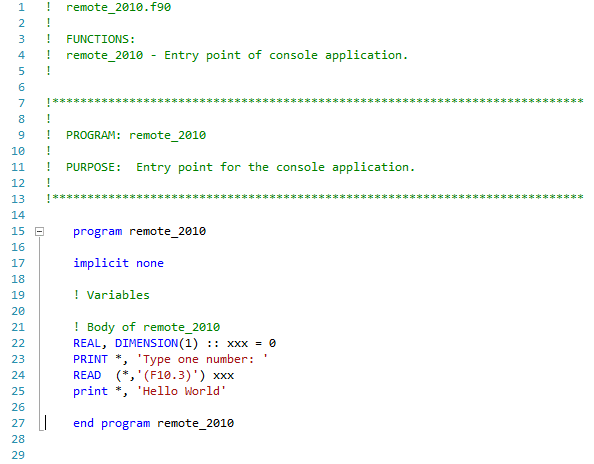
Add the following lines to the remote_2012.f90 file:
REAL, DIMENSION(1) :: xxx = 0
PRINT *, 'Type one number: '
READ  (*,'(F10.3)') xProject > Propertiesxx
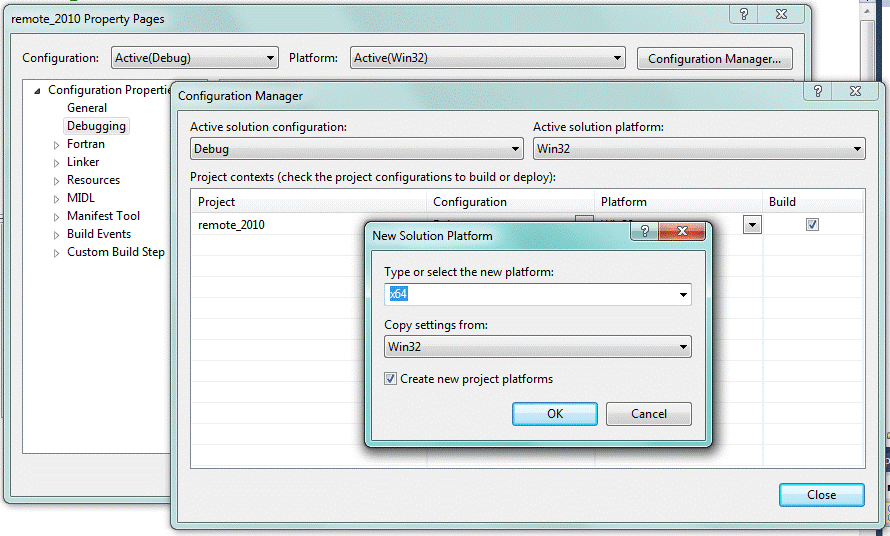
Open Project > Properties and create a new platform configuration for x64 using the Configuration Manager.

Make sure, that current (target) configuration is Debug|x64 and build the solution (Build > Build Solution). This invokes the cross-compiler and causes the 64-bit executable file remote_2012.exe to be built.
Run the remote_2012.exe application to make sure that it is 64-bit code. An error should result, explaining that it is not a valid Win32 application.
Run the Remote Desktop Connection program (%SystemRoot%\System32\mstsc.exe) and connect to the remote machine (REMOTE_SERVER).
Create C:\remote_dir on REMOTE_SERVER and copy remote_2012.exe from HOST_MACHINE to REMOTE_SERVER.
On the HOST_MACHINE open the remote_2012.f90 source file in the Visual Studio editor.
Set a breakpoint at line 27.

Open Project > Properties for remote debugging and set the following properties:
Connection: Remote with Windows authentication
Remote Machine: REMOTE_SERVER
Remote Command: C:\remote_dir\remote_2012.exe
Press F5 to start debugging.
If there is a firewall you will get an Unable to start debugging error message. In this case go to REMOTE_SERVER and run Remote Debugging Monitor (64-bit mode). Go back to LOCAL_SERVER and press F5 to start debugging.
Go to REMOTE_SERVER and make sure that the remote_2012 application is started.
Type 5 and press Enter. Go back to HOST_MACHINE.
Verify that the Debugger reaches the breakpoint at the line 27.
Open the Locals window and make sure that value xxx is 64-bit.
Press Shift+F5 to stop debugging and terminate the application on the remote server.
Open the project properties again and set Attach to Yes.
Press Ctrl+F5 (remote execution).
Press F5 for attaching to a process.
Repeat steps 12-17 to check that the attach to process works correctly.
Open Project > Properties and set Attach to No.
Open Project > Properties and set Connection to Remote with no authentication (Native only).
Go to REMOTE_SERVER and switch debugging monitor to No Authentication mode using the Tools > Options menu.
Repeat steps 12-22 to check that Remote with no authentication (Native only) mode works correctly.
Results of Remote Debugging Exercise
The results of this remote debugging exercise for Visual Studio* 2012 are summarized in the table below.
Connection Type |
Session |
Result |
Debugging Monitor status |
|---|---|---|---|
Remote with Windows authentication |
Debug (F5) |
Works |
Monitor should be run in Windows Authentication mode. |
Execute (Ctrl +F5) |
Works |
||
Attach to Process |
Works |
||
Remote with no authentication (Native only) |
Debug (F5) |
Works |
Monitor should be run in No Authentication mode. |
Execute (Ctrl +F5) |
Works |
||
Attach to Process |
Works |